
Malware, or malicious software, is any program or file that is harmful to a computer user. Malware includes computer viruses, worms, Trojan horses and spyware. These malicious programs can perform a variety of functions, including stealing, encrypting or deleting sensitive data, altering or hijacking core computing functions and monitoring users’ computer activity without their permission. Once a machine is infected by malware, criminals can hurt consumers and enterprises in many ways. Cybercrimes have been increasing and the global cost of cybercrime has now reached as much as 600 billion dollars — about 0.8 percent of global GDP.
To minimize risk, is it possible to predict the chance of machine getting infected using machine learning?
Let us look at a dataset provided by Microsoft 1 and see if we can use the power of machine learning to predict risk of a machine getting infected by malware.
Note: Click the Toggle Code button below if you want to have a look at python script.
[showhide type="post"]
from IPython.display import display
from IPython.display import HTML
import IPython.core.display as di # Example: di.display_html('<h3>%s:</h3>' % str, raw=True)

# This line will hide code by default when the notebook is exported as HTML
di.display_html('<script>jQuery(function() {if (jQuery("body.notebook_app").length == 0) { jQuery(".input_area").toggle(); jQuery(".prompt").toggle();}});</script>', raw=True)

# This line will add a button to toggle visibility of code blocks, for use with the HTML export version
di.display_html('''<button onclick="jQuery('.input_area').toggle(); jQuery('.prompt').toggle();">Toggle Code</button>''', raw=True)

#We set the types of each fields in the train set in order to reduce the memory usage dtypes = { 'MachineIdentifier': 'category', 'ProductName': 'category', 'EngineVersion': 'category', 'AppVersion': 'category', 'AvSigVersion': 'category', 'IsBeta': 'int8', 'RtpStateBitfield': 'float16', 'IsSxsPassiveMode': 'int8', 'DefaultBrowsersIdentifier': 'float16', 'AVProductStatesIdentifier': 'float32', 'AVProductsInstalled': 'float16', 'AVProductsEnabled': 'float16', 'HasTpm': 'int8', 'CountryIdentifier': 'int16', 'CityIdentifier': 'float32', 'OrganizationIdentifier': 'float16', 'GeoNameIdentifier': 'float16', 'LocaleEnglishNameIdentifier': 'int8', 'Platform': 'category', 'Processor': 'category', 'OsVer': 'category', 'OsBuild': 'int16', 'OsSuite': 'int16', 'OsPlatformSubRelease': 'category', 'OsBuildLab': 'category', 'SkuEdition': 'category', 'IsProtected': 'float16', 'AutoSampleOptIn': 'int8', 'PuaMode': 'category', 'SMode': 'float16', 'IeVerIdentifier': 'float16', 'SmartScreen': 'category', 'Firewall': 'float16', 'UacLuaenable': 'float32', 'Census_MDC2FormFactor': 'category', 'Census_DeviceFamily': 'category', 'Census_OEMNameIdentifier': 'float16', 'Census_OEMModelIdentifier': 'float32', 'Census_ProcessorCoreCount': 'float16', 'Census_ProcessorManufacturerIdentifier': 'float16', 'Census_ProcessorModelIdentifier': 'float16', 'Census_ProcessorClass': 'category', 'Census_PrimaryDiskTotalCapacity': 'float32', 'Census_PrimaryDiskTypeName': 'category', 'Census_SystemVolumeTotalCapacity': 'float32', 'Census_HasOpticalDiskDrive': 'int8', 'Census_TotalPhysicalRAM': 'float32', 'Census_ChassisTypeName': 'category', 'Census_InternalPrimaryDiagonalDisplaySizeInInches': 'float16', 'Census_InternalPrimaryDisplayResolutionHorizontal': 'float16', 'Census_InternalPrimaryDisplayResolutionVertical': 'float16', 'Census_PowerPlatformRoleName': 'category', 'Census_InternalBatteryType': 'category', 'Census_InternalBatteryNumberOfCharges': 'float32', 'Census_OSVersion': 'category', 'Census_OSArchitecture': 'category', 'Census_OSBranch': 'category', 'Census_OSBuildNumber': 'int16', 'Census_OSBuildRevision': 'int32', 'Census_OSEdition': 'category', 'Census_OSSkuName': 'category', 'Census_OSInstallTypeName': 'category', 'Census_OSInstallLanguageIdentifier': 'float16', 'Census_OSUILocaleIdentifier': 'int16', 'Census_OSWUAutoUpdateOptionsName': 'category', 'Census_IsPortableOperatingSystem': 'int8', 'Census_GenuineStateName': 'category', 'Census_ActivationChannel': 'category', 'Census_IsFlightingInternal': 'float16', 'Census_IsFlightsDisabled': 'float16', 'Census_FlightRing': 'category', 'Census_ThresholdOptIn': 'float16', 'Census_FirmwareManufacturerIdentifier': 'float16', 'Census_FirmwareVersionIdentifier': 'float32', 'Census_IsSecureBootEnabled': 'int8', 'Census_IsWIMBootEnabled': 'float16', 'Census_IsVirtualDevice': 'float16', 'Census_IsTouchEnabled': 'int8', 'Census_IsPenCapable': 'int8', 'Census_IsAlwaysOnAlwaysConnectedCapable': 'float16', 'Wdft_IsGamer': 'float16', 'Wdft_RegionIdentifier': 'float16', 'HasDetections': 'int8' }

#We have two files train and test, we will performing the training first and check our prediction model on test file. train = pd.read_csv('train_sample.csv', dtype=dtypes) test = pd.read_csv('test_sample.csv', dtype=dtypes)
[/showhide]
Table of Contents
1) Descriptive Statistics
2) Exploratory data analysis
3) Feature engineering
4) Summary
Descriptive Statistics
We have a huge dataset with 84 attributes. The goal of this dataset is to predict a Windows machine’s probability of getting infected by various families of malware, based on different properties of that machine. The data containing these properties and the machine infections was generated by combining heartbeat and threat reports collected by Microsoft’s endpoint protection solution, Windows Defender.
MachineIdentifier | ProductName | EngineVersion | AppVersion | AvSigVersion | IsBeta | RtpStateBitfield | IsSxsPassiveMode | DefaultBrowsersIdentifier | AVProductStatesIdentifier | … | Census_FirmwareVersionIdentifier | Census_IsSecureBootEnabled | Census_IsWIMBootEnabled | Census_IsVirtualDevice | Census_IsTouchEnabled | Census_IsPenCapable | Census_IsAlwaysOnAlwaysConnectedCapable | Wdft_IsGamer | Wdft_RegionIdentifier | HasDetections | |
|---|---|---|---|---|---|---|---|---|---|---|---|---|---|---|---|---|---|---|---|---|---|
| Unnamed: 0 | |||||||||||||||||||||
| 1713700 | 312ee21c55c435e926e8d697463cb3b0 | win8defender | 1.1.15200.1 | 4.18.1806.18062 | 1.275.202.0 | 0 | 7.0 | 0 | NaN | 53447.0 | … | 64689.0 | 1 | 0.0 | 0.0 | 0 | 0 | 0.0 | 0.0 | 3.0 | 1 |
| 2218958 | 3fab37ea700827f06691984cc03652eb | win8defender | 1.1.15200.1 | 4.18.1807.18075 | 1.275.1141.0 | 0 | 7.0 | 0 | NaN | 47380.0 | … | 51910.0 | 0 | NaN | 0.0 | 1 | 0 | 0.0 | 0.0 | 15.0 | 1 |
| 2720229 | 4e0bd7c65da468f9bfb5939582358310 | win8defender | 1.1.15200.1 | 4.18.1807.18075 | 1.275.569.0 | 0 | 7.0 | 0 | NaN | 50188.0 | … | 6899.0 | 0 | NaN | 0.0 | 0 | 0 | 0.0 | 1.0 | 3.0 | 1 |
| 4079822 | 75114848cf4f7e16a317ba8f15efd1b2 | win8defender | 1.1.15100.1 | 4.18.1807.18075 | 1.273.1616.0 | 0 | 7.0 | 0 | NaN | 53447.0 | … | 63555.0 | 1 | NaN | 0.0 | 0 | 0 | 0.0 | 0.0 | 3.0 | 1 |
| 1693213 | 30993d30aa1c94e4e75032884e4d99e2 | win8defender | 1.1.15100.1 | 4.18.1807.18075 | 1.273.778.0 | 0 | 7.0 | 0 | NaN | 53447.0 | … | 19951.0 | 1 | NaN | 0.0 | 0 | 0 | 0.0 | 0.0 | 7.0 | 1 |
5 rows × 83 columns
Each row in this dataset corresponds to a machine, uniquely identified by a MachineIdentifier.
HasDetections is the ground truth and indicates that Malware was detected on the machine.
Let us look at the description of major attributes in the dataset
- MachineIdentifier – Individual machine IDProductName – Defender state information e.g. win8defender
- EngineVersion – Defender state information e.g. 1.1.12603.0
- AppVersion – Defender state information e.g. 4.9.10586.0
- AvSigVersion – Defender state information e.g. 1.217.1014.0
- AVProductStatesIdentifier – ID for the specific configuration of a user’s antivirus software
- CountryIdentifier – ID for the country the machine is located in
- OsVer – Version of the current operating system
- OsPlatformSubRelease – Returns the OS Platform sub-release (Windows Vista, Windows 7, Windows 8, TH1, TH2)
- SmartScreen – This is the SmartScreen enabled string value from registry. If the value exists but is blank, the value “ExistsNotSet” is sent in telemetry.
- Firewall – This attribute is true (1) for Windows 8.1 and above if windows firewall is enabled, as reported by the service.UacLuaenable – This attribute reports whether or not the “administrator in Admin Approval Mode” user type is disabled or enabled in UAC.Census_ProcessorCoreCount – Number of logical cores in the processor
- Census_PrimaryDiskTotalCapacity – Amount of disk space on primary disk of the machine in MB
- Census_SystemVolumeTotalCapacity – The size of the partition that the System volume is installed on in MB
- Census_TotalPhysicalRAM – Retrieves the physical RAM in MB
- Census_GenuineStateName – Friendly name of OSGenuineStateID. 0 = Genuine
- Census_IsTouchEnabled – Is this a touch device ?
It is a large dataset but let us see based on various attributes of a machine, can we predict if a machine will get hit by a malware?
Let us look at the distribution of outcome variable
HasDetections is the ground truth and indicates that Malware was detected on the machine.
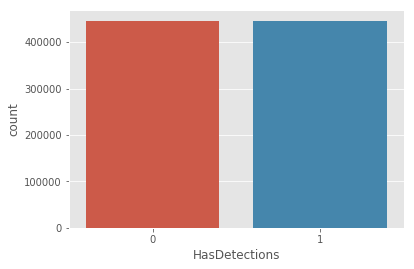
We can see we have a balanced dataset, that means dataset has been sampled to include a much larger proportion of malware machines.
Exploratory data analysis
Let us have a look at the categorical variables
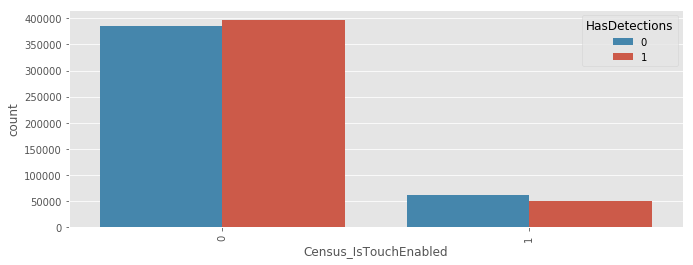
We can see that the detections are less in Touch devices.
The rate of infections is lower for touch devices
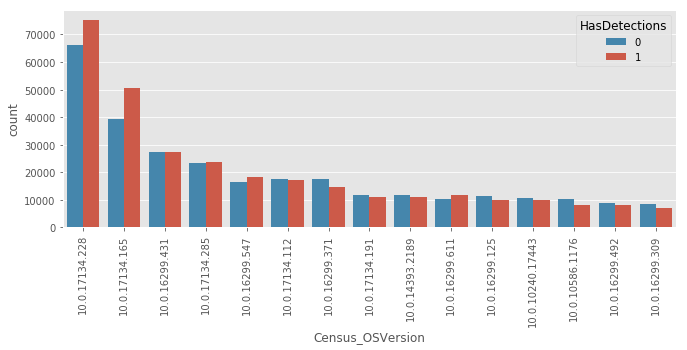
We can see that there is a significant difference in detection levels based on the Os versions.
Hence we can see that depending upon the attributes the risks of getting infected can change!
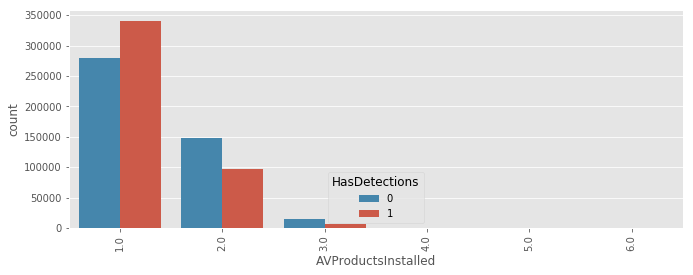
This is the number of Antivirus products installed. In case of a single antivirus, the rate of detection is high. Installing two Antivirus products decreases the rate of detection.
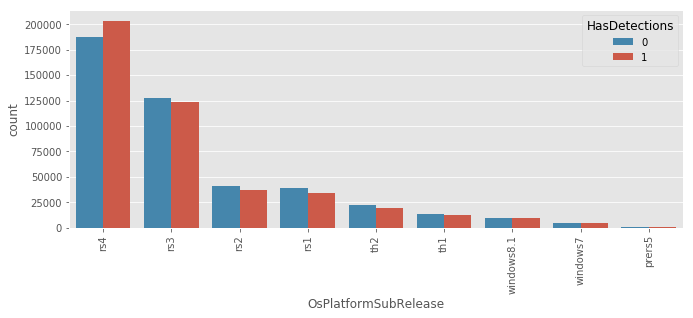
RS indicates Redstone and th is threshold which are both versions of windows 10.
Also we can see that rs4 has more number of detections this maybe as it was a new version
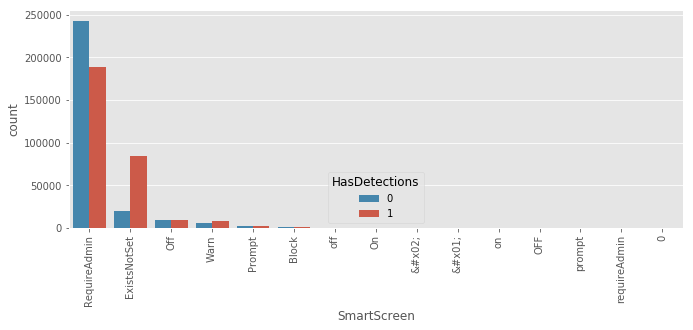
SmartScreen Filter helps to identify reported phishing and malware websites and also helps you make informed decisions about downloads.
As you browse the web, it analyzes pages and determines if they might be suspicious.
If it finds a match, SmartScreen will show you a warning letting you know that the site has been blocked for your safety.
SmartScreen checks files that you download from the web against a list of reported malicious software sites and programs known to be unsafe.
This is the SmartScreen enabled string value from registry. We can see that if it exists and is not set can have a large number of detections!
We will see it is the most important feature in detection
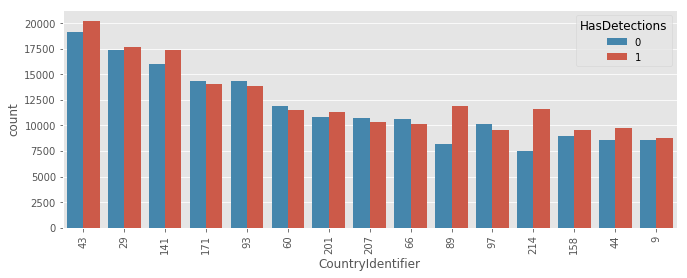
We can see the detection levels differ a lot based on country. This could be a good feature.
Feature engineering
We can see these columns have high cardinality, frequency encoding will ranking the categories with respect to their frequencies. These variables are then treated as numerical.
And we can then use them in our model
Now that we are done with feature engineering let us move to machine learning and prediction.
Machine Learning
Let us make use of lgbm, Light GBM is a gradient boosting framework that uses tree based learning algorithm.
Light GBM is a fast, distributed, high-performance gradient boosting framework based on decision tree algorithm, used for ranking, classification and many other machine learning tasks.
Following are the cross validation scores for the training data inorder to create an optimized model with high accuracy. We made use of cross validation with 5 folds, the advantage of this method is that all observations are used for both training and validation, and each observation is used for validation exactly once.
fold n°0
Training until validation scores don't improve for 200 rounds.
[100]	training's auc: 0.751319	valid_1's auc: 0.720071
[200]	training's auc: 0.769667	valid_1's auc: 0.721429
[300]	training's auc: 0.781697	valid_1's auc: 0.721092
Early stopping, best iteration is:
[185]	training's auc: 0.767497	valid_1's auc: 0.721497
time elapsed: 0.038s
fold n°1
Training until validation scores don't improve for 200 rounds.
[100]	training's auc: 0.751309	valid_1's auc: 0.721836
[200]	training's auc: 0.769685	valid_1's auc: 0.722959
[300]	training's auc: 0.78145	valid_1's auc: 0.722416
[400]	training's auc: 0.791111	valid_1's auc: 0.721733
Early stopping, best iteration is:
[214]	training's auc: 0.771747	valid_1's auc: 0.723126
time elapsed: 0.079s
fold n°2
Training until validation scores don't improve for 200 rounds.
[100]	training's auc: 0.751524	valid_1's auc: 0.720615
[200]	training's auc: 0.769441	valid_1's auc: 0.721717
[300]	training's auc: 0.781359	valid_1's auc: 0.721405
[400]	training's auc: 0.79129	valid_1's auc: 0.721
Early stopping, best iteration is:
[203]	training's auc: 0.769872	valid_1's auc: 0.721767
time elapsed: 0.12 s
fold n°3
Training until validation scores don't improve for 200 rounds.
[100]	training's auc: 0.7513	valid_1's auc: 0.720716
[200]	training's auc: 0.769799	valid_1's auc: 0.721748
[300]	training's auc: 0.782024	valid_1's auc: 0.721542
Early stopping, best iteration is:
[190]	training's auc: 0.768455	valid_1's auc: 0.72178
time elapsed: 0.16 s
fold n°4
Training until validation scores don't improve for 200 rounds.
[100]	training's auc: 0.751782	valid_1's auc: 0.722352
[200]	training's auc: 0.769942	valid_1's auc: 0.723223
[300]	training's auc: 0.781948	valid_1's auc: 0.722633
[400]	training's auc: 0.791381	valid_1's auc: 0.721827
Early stopping, best iteration is:
[202]	training's auc: 0.770309	valid_1's auc: 0.72333
time elapsed: 0.2  s
CV score: 0.72230
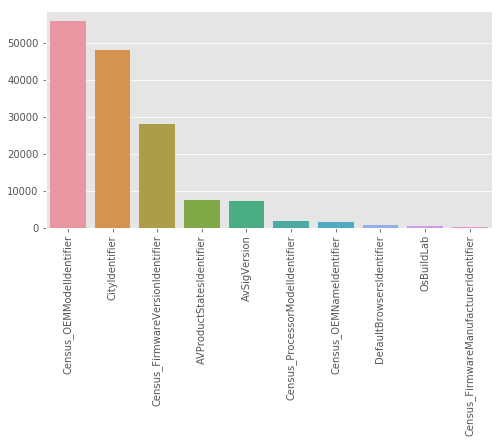
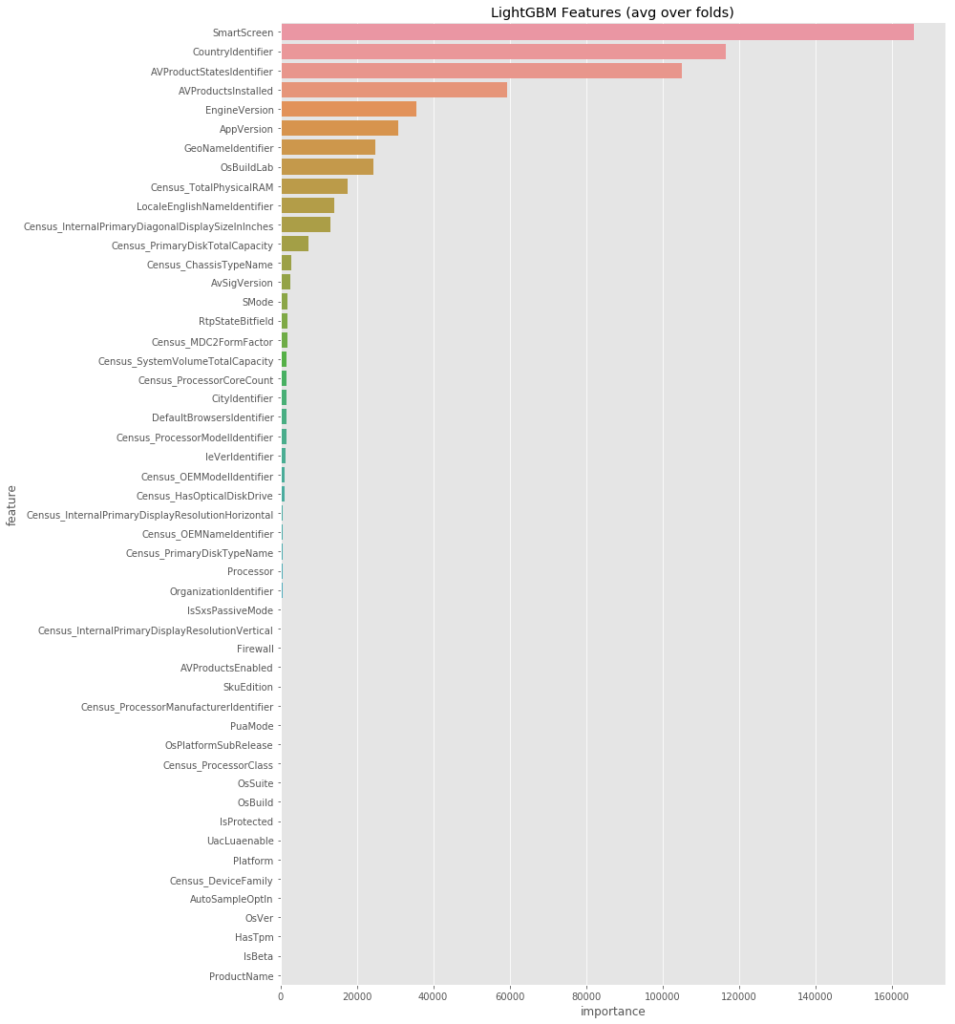
Features that were most useful for prediction
We got an accuracy of 68.1 % on test dataset after submitting on kaggle.
These results represent machines and the risk of being affected based on their features.
| Machine | Risk of Infection | |
|---|---|---|
| 0 | bbd32c3d6e6673dab113227a96ea1614 | 33.8% |
| 1 | e5544db56485780c556ae0faa49a0dda | 46.1% |
| 2 | 7b5a256ef0a3e28f9cebfa6e05b1427a | 42.3% |
| 3 | 772afbaa64c2169494d0146a614fafff | 23.3% |
| 4 | df1cc7ed605e68570ec5cecb2232f5c4 | 46.7% |
| 5 | e64a52d52410e58b173a770b99ea75e4 | 43.9% |
| 6 | 23e15d0ab76ed2de40d423b10a691ec8 | 52.8% |
| 7 | 9da269745fc049f4ec790111aa7c42c8 | 19.9% |
| 8 | d600da38bf735caad71cd5c9100c172f | 39.8% |
| 9 | 75d6b6247d558385de5c6e9242d73715 | 25.7% |
Summary
Thus we have performed analysis on the attributes of a machine and found the attributes that are most important for predicting the risk of infection. SmartScreen, CountryIdentifier, AVProductStatesIdentifier, AVProductsInstalled, EngineVersion are some of the most important features that were helpful for the prediction.
SmartScreen was the most important feature and it helps to identify reported phishing and malware websites and also helps you make informed decisions about downloads. We have see from the analysis if it exists and is not set can have a large number of detections!
CountryIdentifier indicates the source country of the machine and we can see that malware rates varies across countries and is a strong identifier.
AVProductsInstalled indicates the number of Antivirus products installed.
Appversion and EngineVersion indicates the version of Windows defender.
This means if we have information about a machine then we can predict the chances of them getting infected and hence if the risks are high then we can take counter measures accordingly.
Hence we can see by making use of machine learning we can identify the risks of infection and prevent our machines from getting infected!
Future scope
More complex models using deep learning can be utilized which can help to improve the accuracy further. By making use of deep learning we can create a model that learns on its own by performing a task repeatedly, each time tweaking it a little to improve the outcome.
1. Data Source: https://www.kaggle.com/c/microsoft-malware-prediction ↩